Live Instruments
EQ Sight includes two real-time instruments that operate directly in your browser, streaming continuous waveform data from EQ Wave sensors at 32 ksps.
Accessing Live Instruments
From the device page, click Live Instruments. The page opens with the Oscilloscope view by default.
The header bar provides:
| Control | Purpose |
|---|---|
| Oscilloscope / Spectrum Analyzer | Switch between instruments |
| Triggered / Free-Running | Waveform capture mode (oscilloscope only) |
| Pause / Refresh | Pause data stream or reconnect (oscilloscope only) |
| Channel buttons (VA, VB, VC, IA, IB, IC, IN) | Select channels to display |
| Resolution | FFT frequency resolution (spectrum analyzer only) |
| THD | Total harmonic distortion readout (spectrum analyzer only) |
Oscilloscope
The oscilloscope displays live voltage and current waveforms with zero-crossing triggered capture.
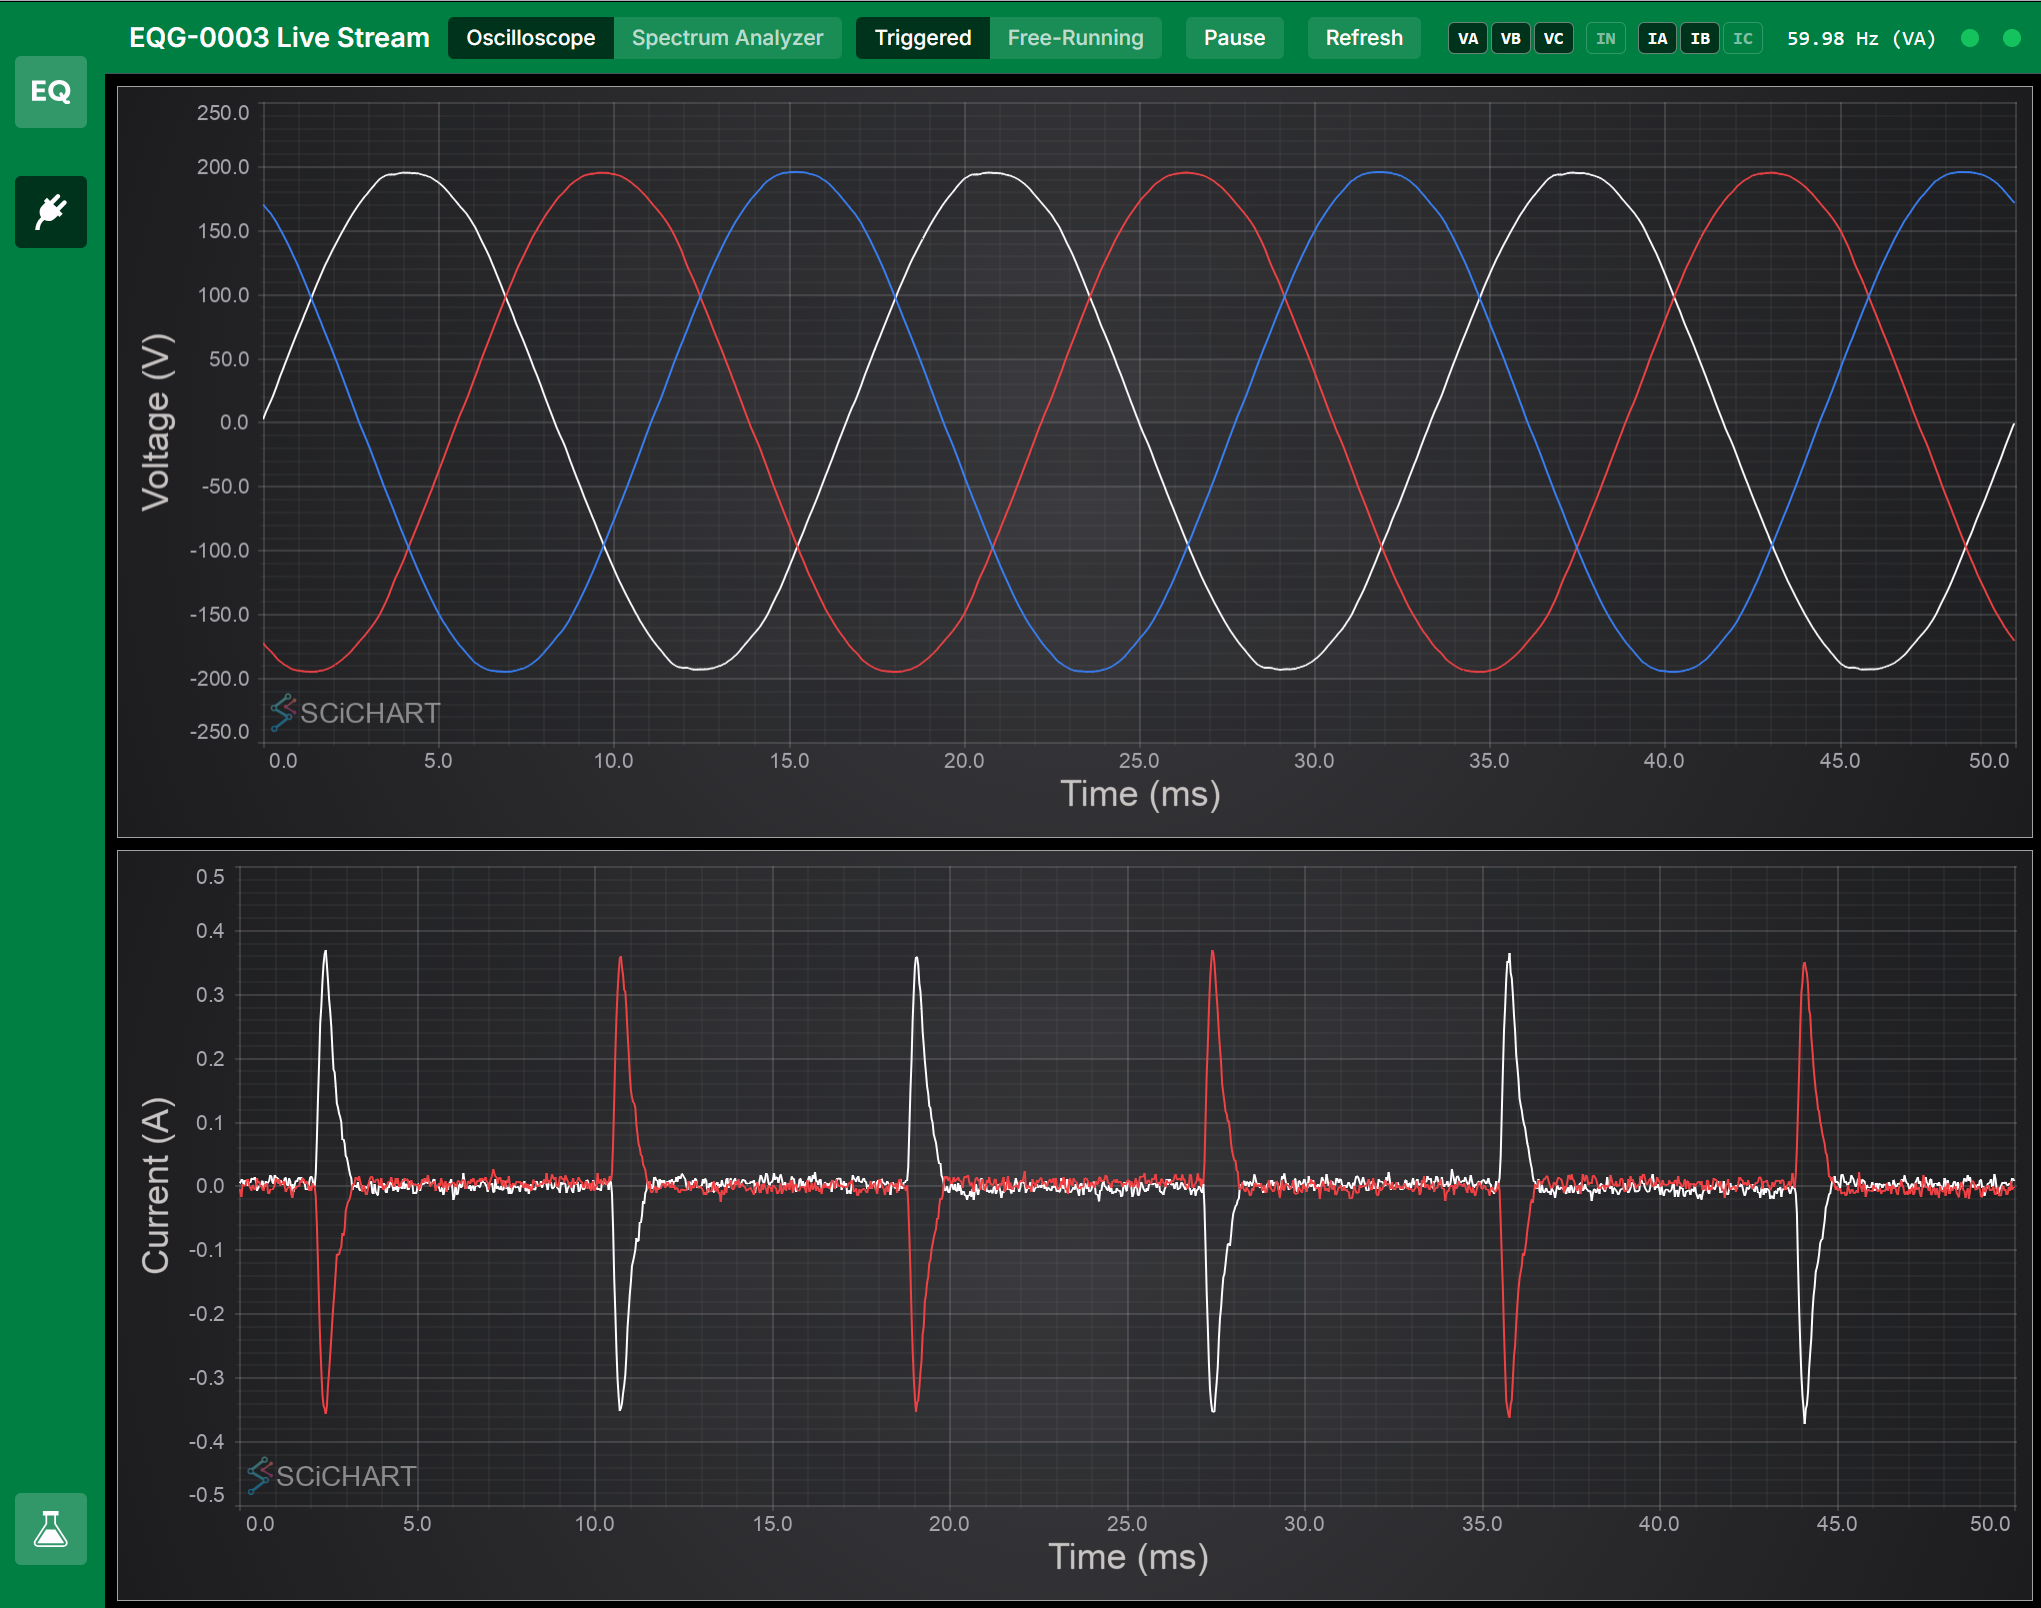
Triggered mode locks the display to rising zero crossings on the highest-priority voltage channel, producing a stable, oscilloscope-like view. The number of displayed cycles is adjustable via mouse wheel scroll on the chart.
Free-running mode shows a continuous rolling window of raw waveform data.
The frequency readout (e.g., “59.98 Hz (VA)”) is measured from interpolated zero crossings on the trigger channel, giving sub-Hz accuracy from the 32 ksps sample clock.
Channel selection
Click channel buttons to toggle individual phases on or off. Multiple channels can be active simultaneously. Voltage channels appear in the upper chart; current channels in the lower chart.
A high-pass filter (7 Hz corner frequency) automatically removes sensor DC offset from current channels.
Spectrum Analyzer
The spectrum analyzer provides a real-time FFT spectrogram with a live spectrum line chart.
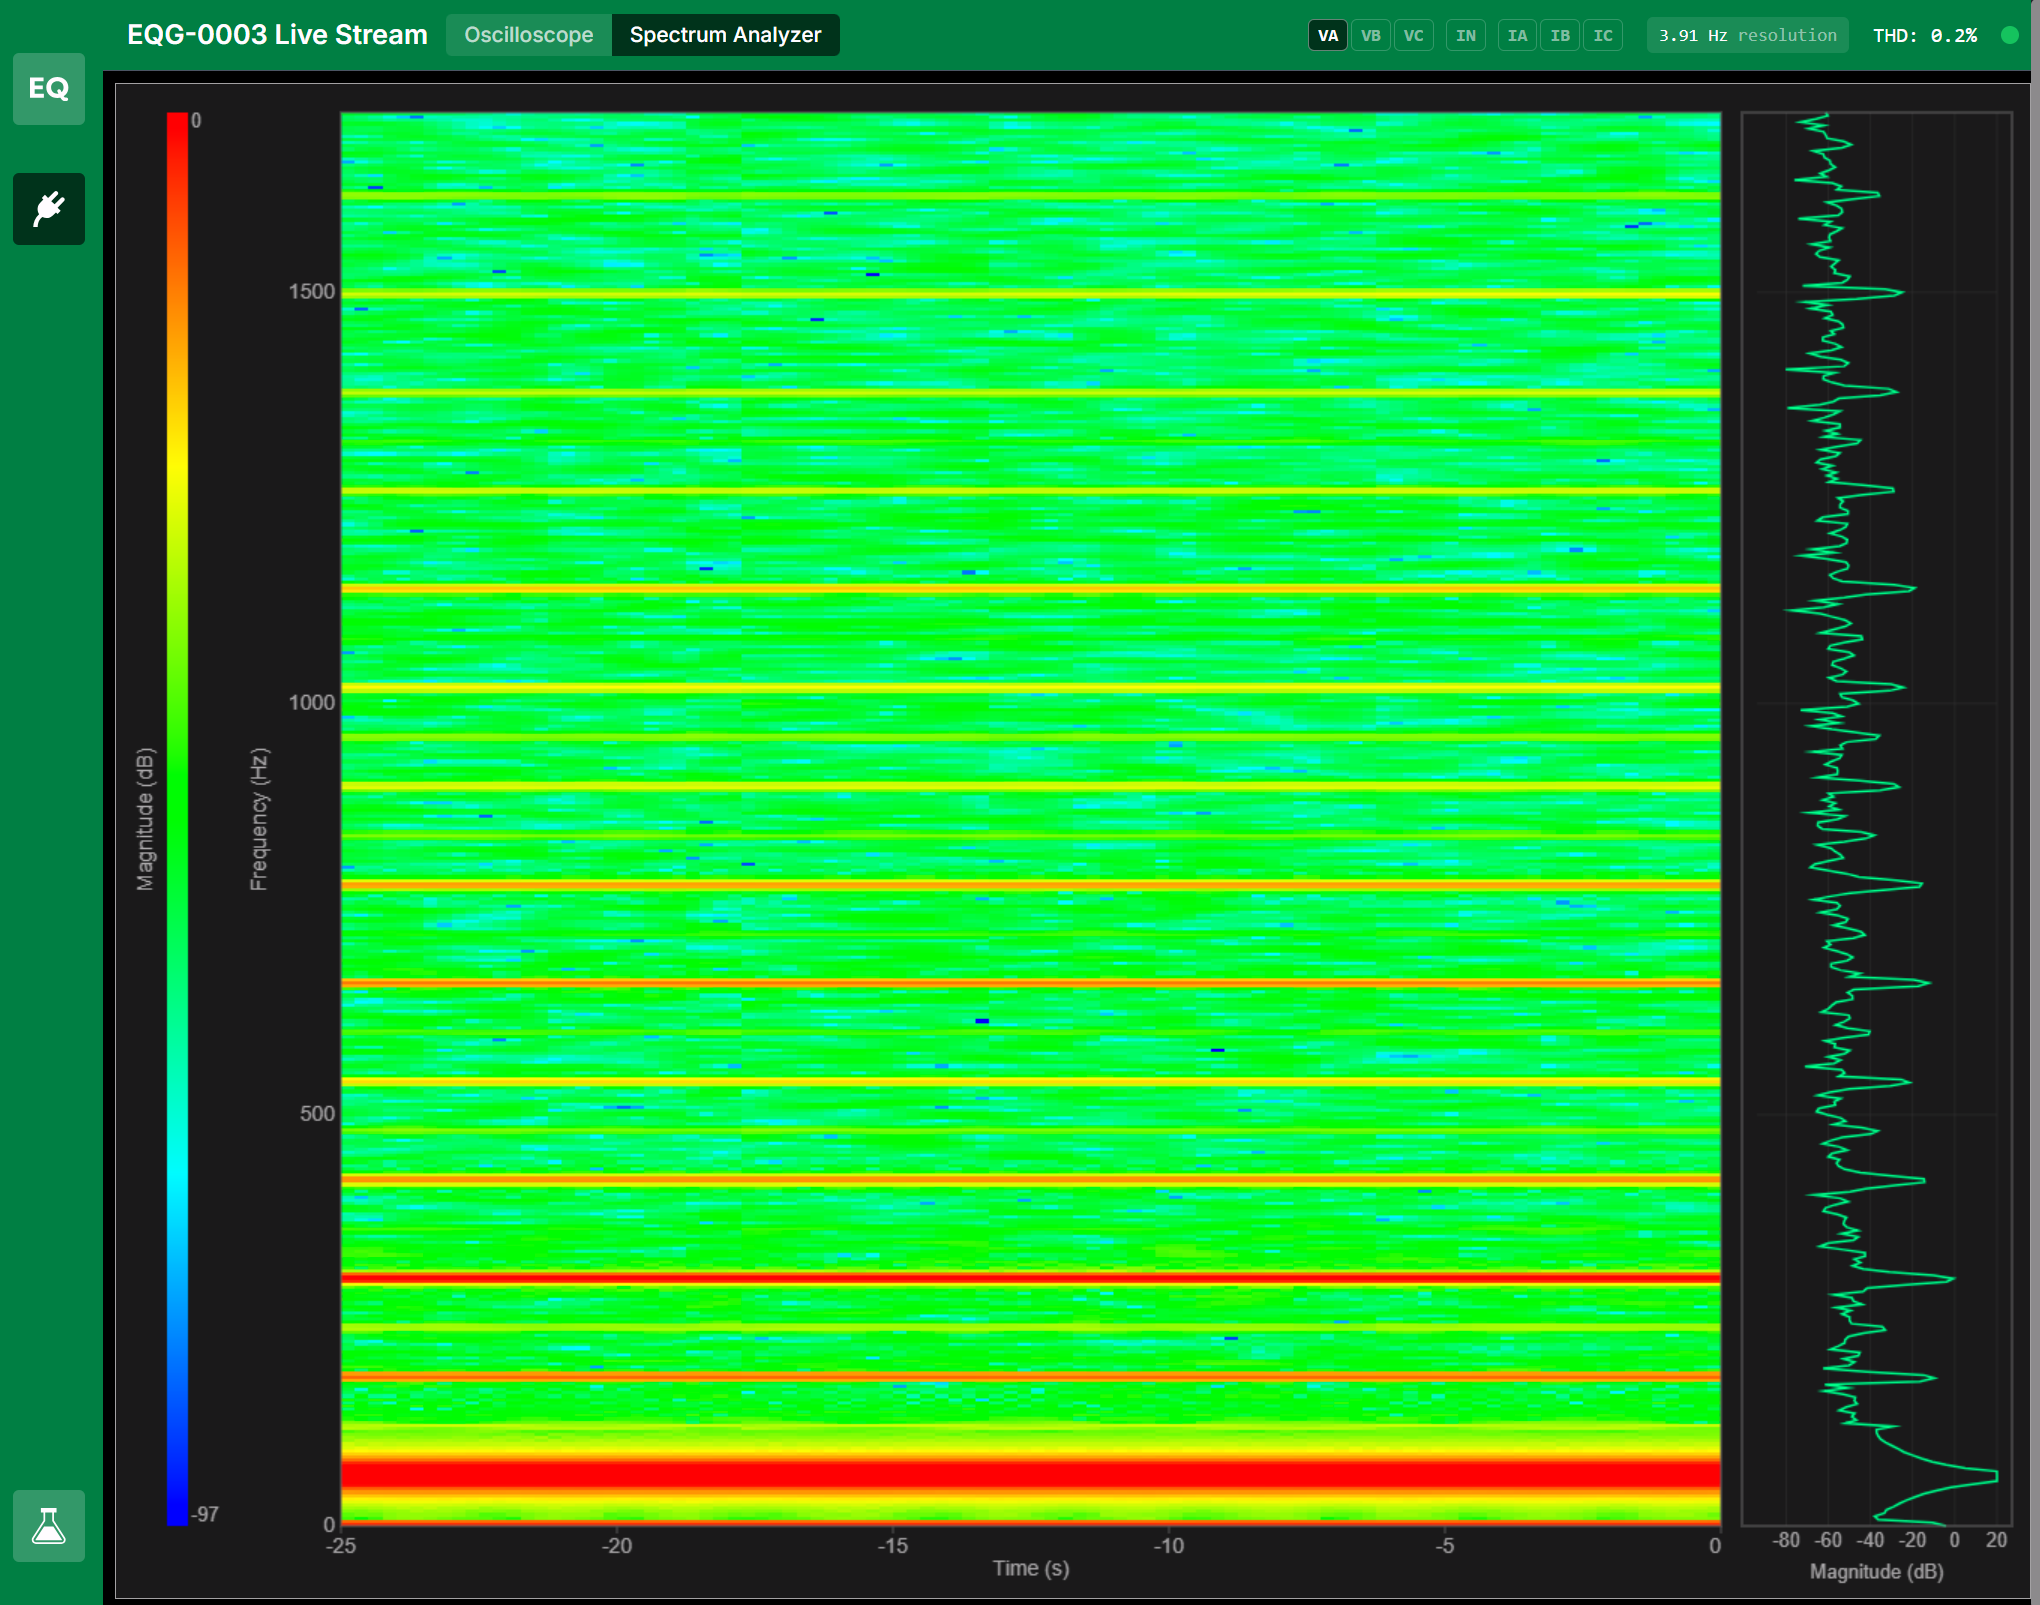
The display has three sections:
- Color bar (left) — Magnitude scale in dB
- Waterfall spectrogram (center) — Rolling time-frequency heatmap. Time flows from left (25 seconds ago) to right (now). Color indicates magnitude.
- Spectrum line (right) — Current FFT snapshot at the leading edge of the waterfall, showing magnitude vs. frequency
Frequency range
Scroll the mouse wheel over the spectrogram to zoom the frequency axis:
- Scroll up — Zoom in (narrower range, more detail on low-frequency harmonics)
- Scroll down — Zoom out (up to 8 kHz, the anti-alias corner frequency)
The frequency range is anchored at 0 Hz (bottom).
Resolution
Click the resolution indicator in the header bar to cycle through available settings:
| Resolution | FFT size | Window length | Best for |
|---|---|---|---|
| 7.81 Hz | 4096 | 128 ms | Fast response, clear harmonic bands |
| 3.91 Hz | 8192 | 256 ms | Good balance of detail and speed |
| 1.95 Hz | 16384 | 512 ms | Fine harmonic separation |
| 0.98 Hz | 32768 | 1024 ms | Sub-Hz resolution, slowest update |
Channel selection
In spectrum analyzer mode, channel buttons switch to single-select. Only one channel is analyzed at a time. The WebSocket connection updates to stream only the selected channel.
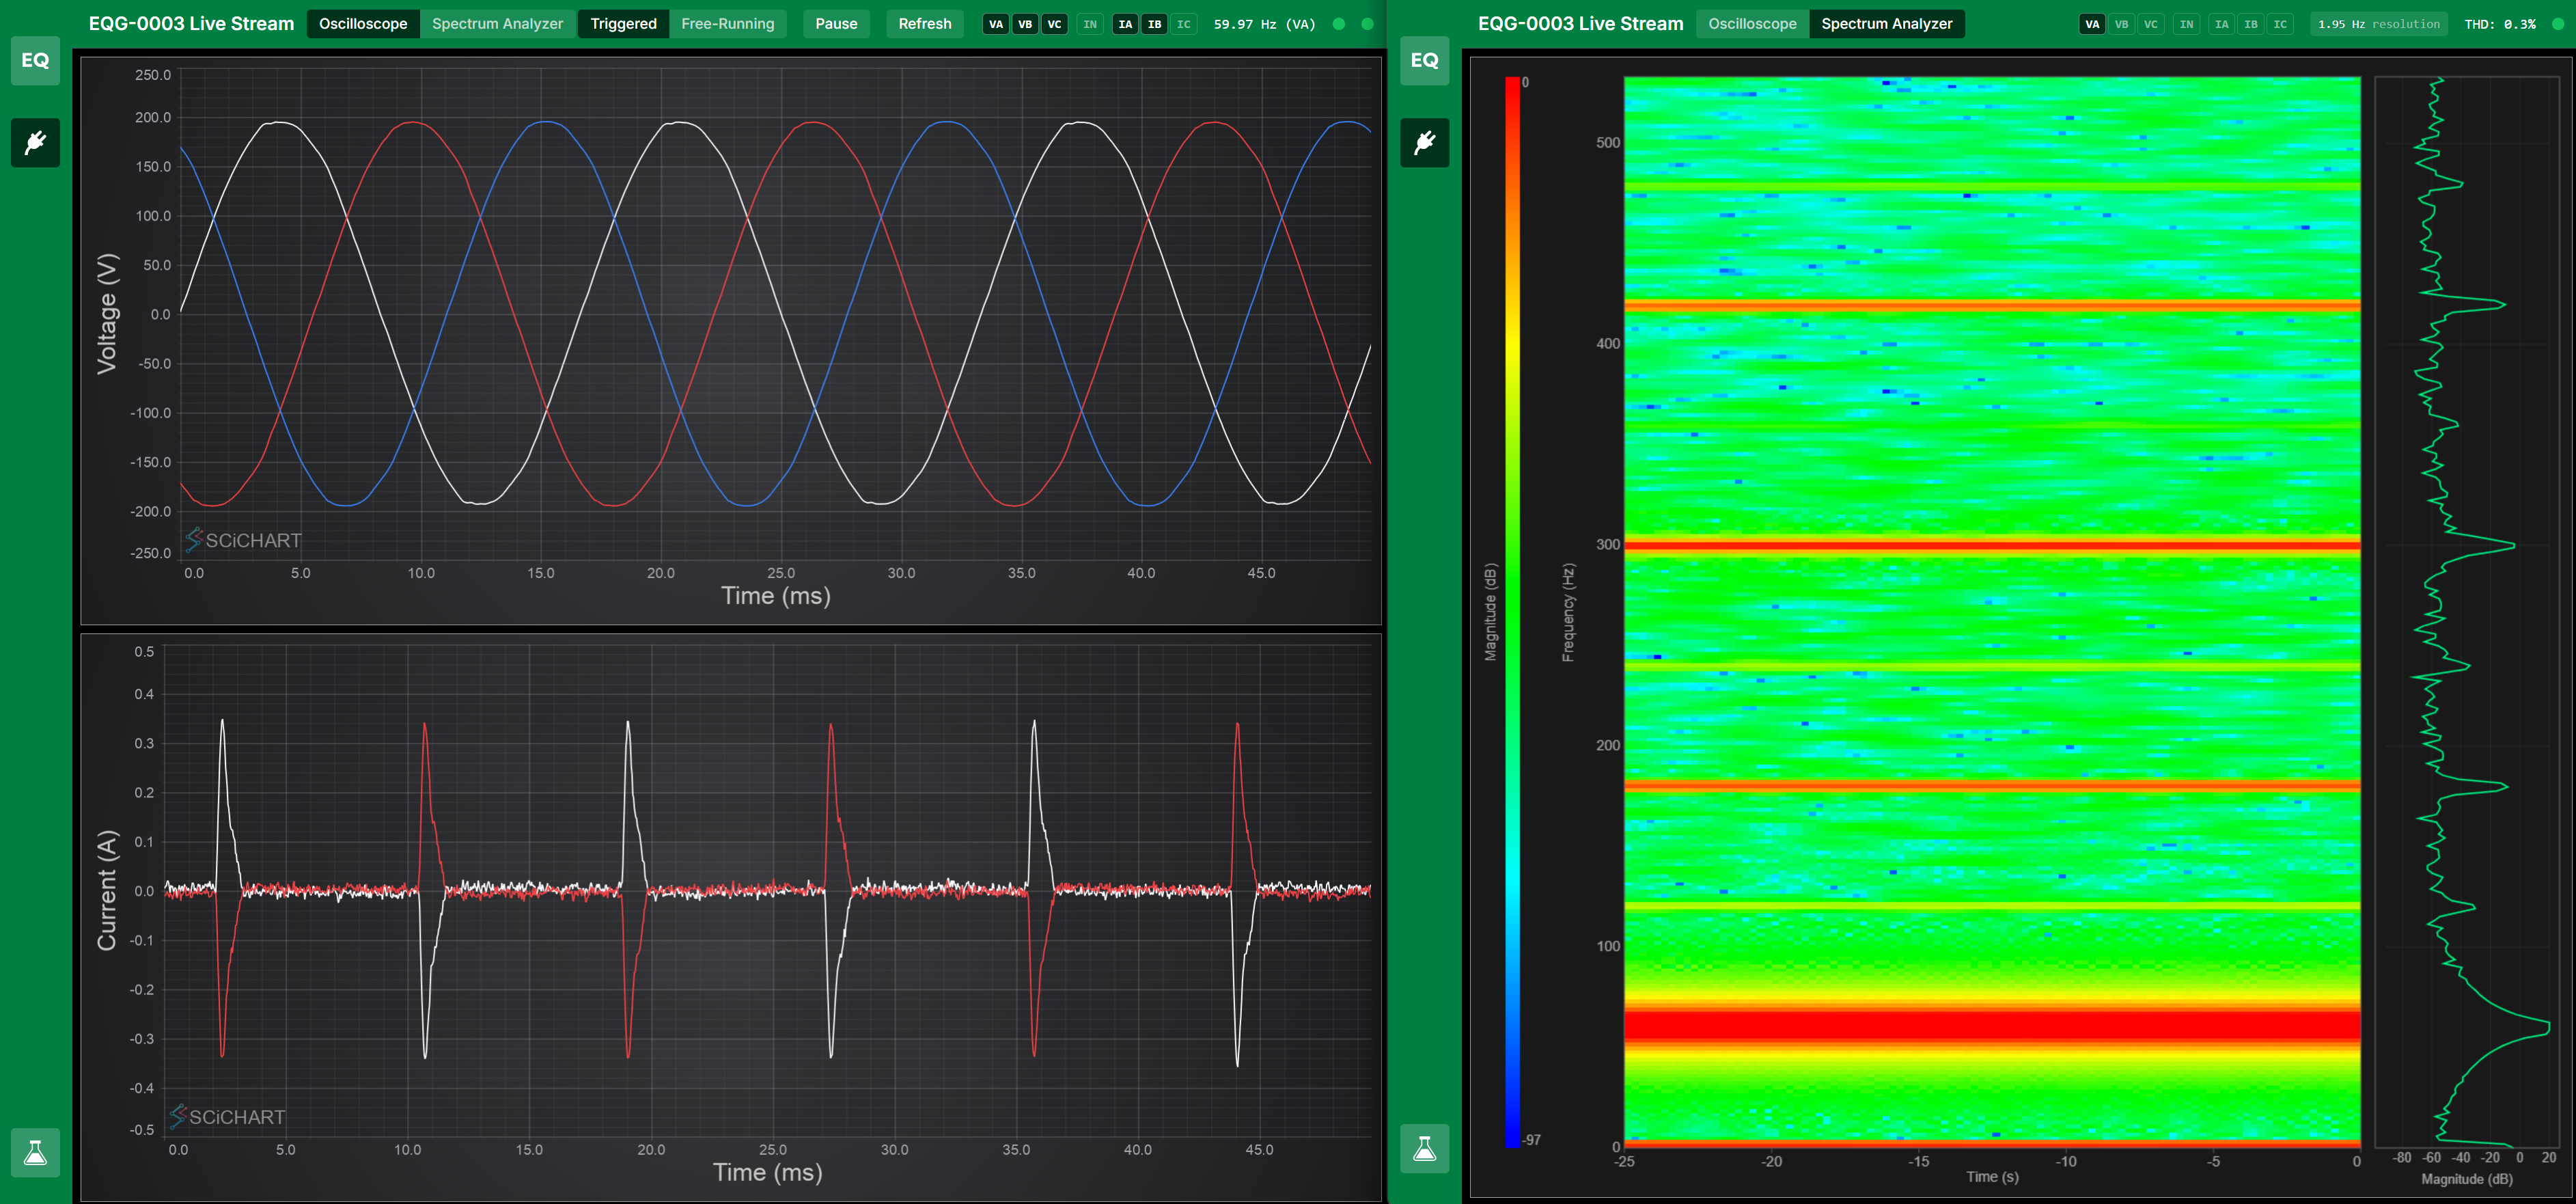
Side-by-Side Operation
Both instruments can run simultaneously in separate browser windows or tabs, streaming from the same device.
URL State
All instrument settings are preserved in the URL for bookmarking and sharing:
mode=triggered/mode=free-running/mode=spectrogramchannels=VA,IA(multi-select) orchannels=VA(single in spectrum mode)fftSize=4096andfreqMax=8000(spectrum analyzer settings)cycles=5(triggered mode cycle count)